PATIENT SPECIFIC MODELING OF INTERNAL DEFIBRILLATION USING THE FINITE
VOLUME METHOD
Daniel
Mocanu*, M.S., Joachim Kettenbach**, M.D., Michael O.
Sweeney***, M.D., Solomon
R. Eisenberg, Sc.D*.
* Department
of Biomedical Engineering, Boston University, U.S.A (mocanu@bu.edu)
** Division
of Radiology, University Hospital of Vienna, Austria
*** Division
of Cardiology, Brigham and Women’s Hospital, Boston, U.S.A.
Determination
of the defibrillation threshold (DFT) during implantation of a cardioverter defibrillator
(ICD) remains largely an empirical process. The goal of this research study is
to investigate the predictive capacity of computational models of
defibrillation by comparing patient-specific simulated and clinical
defibrillation metrics. This paper describes the methods we used to construct
patient specific 3-D computer models of the human thorax and to extract the
defibrillation parameters specific to each individual. The finite volume models
are constructed from segmented cross-sectional computerized tomographic (CT)
images obtained post-implant from Brigham and Women's Hospital. The segmented
data is imported into a computer-aided engineering package (I-DEAS) and two
methods are used to generate the finite volume models. In the first method, the
3-D model of the patient's conductive anatomy is reconstructed using NURBS
surfacing techniques and the resulting geometry is discretized using
tetrahedral control volumes. In the second, the 3-D model is constructed with a
structured meshing algorithm, in which a hexaedral control volume is associated
to each voxel in the segmented image data set. I-DEAS uses a finite volume
formulation to find the potential distribution within the human thorax. The
defibrillation parameters were extracted based on Zipes’ critical mass
criterion.
INTRODUCTION
Ventricular
fibrillation (VF) is a condition marked by unsynchronized contractions of
cardiac muscle cells. It has been suggested [1],[2] that the irregular and
aperiodic electrical complexes observed in the electrocardiogram (ECG) are the
representation of turbulent cardiac electrical activity where wandering wave
fronts of electrical excitation (called “rotors”, “reverberators” or
“vortices”) continually change in shape and direction. During VF, the heart
rate is to high to allow adequate pumping of blood. The resulting lack of blood
flow can cause brain damage or death if not promptly treated. With the advent
of smaller defibrillation generators, catheter electrodes and "active
can" technologies, implantable defibrillators (AICD) employing high-energy
biphasic shocks have become the treatment of choice for patients with
arrhythmias that do not respond to drug therapy. Determination of
defibrillation energy (DFT) required to reset the heart to normal rhythm is mainly
an empirical process. Therefore, to determine the DFT, fibrillation is induced
and a defibrillation shock is delivered. This fibrillation/defibrillation
sequence is repeated following an up-down protocol and the minimum energy shock
sufficient to defibrillate is the DFT. This sequence of events imposes an
immense strain on the myocardium and surrounding tissues.
Recent
computer modeling studies in our laboratory of myocardial current distribution
during defibrillation have shown a good correlation with the overall mean of
reported clinical defibrillation metrics [3]. These findings suggest a possible
use for computational models in the presurgical planning of AICD implantation.
The goal of the current research study is to investigate the predictive capacity
of such computational models by comparing patient-specific simulated and
clinical defibrillation metrics. Ten subjects with implanted AICD have been
recruited for this study. This paper reports the defibrillation metrics
extracted for six of this patients. Models for the addition four patients
recruited for the study have not yet been completed.
METHODS
Model Creation
In order to model post-implantation
patients, X-ray computer tomography (CT) is used to image the thorax anatomy.
The acquisition of the cross-sectional data sets is performed using various
slice width (from 1 mm to 3 mm) depending on patient characteristics. Every CT
image is further processed to identify and classify the tissues. This procedure
is called segmentation
and is done semi-automatically using 3-D SLICER software package [5] at Brigham
and Women’s Hospital , Boston.
Two methods are used to generate the
finite volume models. In the first method, the
3-D model of the patient's conductive anatomy is reconstructed using
NURBS surfacing techniques (fig.1) and the resulting geometry is discretized
using tetrahedral volume elements. In the second, the 3-D model is constructed
with a structured meshing algorithm, in which each voxel in the segmented image
data set is defined as a volume element (fig.2).

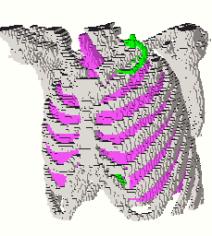
Fig.1 Geometry based model of the human thorax Fig.2 Voxel based model (bones and lungs)
Computational Approach
In the quasistatic limit, the electric potential distribution associated with the defibrillation shock is governed by an elliptic partial differential equation
![]() (1)
(1)
subject to the following boundary conditions:
 (2)
(2)
where
f is the electric potential, s is the electrical
conductivity, ![]() is the surface
normal, Se
is the electrode surface and St is the thoracic surface. The
surface of the AICD’s metallic housing (placed subcutaneous in the left upper
thorax) and the catheter electrodes in the superior vena cava and right
ventricle are given a generic potential boundary of zero, zero and one,
respectively. The finite volume method was used to solve the spatial
distribution of electric potential in the three-dimensional models of human
thorax. The numerical models contained between 350 000 and 450 000 elements.
Solutions were obtained using IDEAS/TMG Thermal Analysis software [4] running
on an SGI Origin 2000.
is the surface
normal, Se
is the electrode surface and St is the thoracic surface. The
surface of the AICD’s metallic housing (placed subcutaneous in the left upper
thorax) and the catheter electrodes in the superior vena cava and right
ventricle are given a generic potential boundary of zero, zero and one,
respectively. The finite volume method was used to solve the spatial
distribution of electric potential in the three-dimensional models of human
thorax. The numerical models contained between 350 000 and 450 000 elements.
Solutions were obtained using IDEAS/TMG Thermal Analysis software [4] running
on an SGI Origin 2000.
Solution interpretation
Every simulation is assumed to correspond to a successful defibrillation with the minimum delivered current, or defibrillation current threshold, Ith. Zipes’ critical mass criterion is used to define successful defibrillation. To meet this criterion, 75% of the myocardium must be exposed to current densities with magnitudes equal to or greater than the inexcitability threshold, Jth=17.5 mA/cm2, which is the minimum current density necessary to render a fibrillating myocyte inexcitable. Inter-electrode impedance Z and defibrillation threshold energy (DFT), current Ith and voltage Vth are standard clinical metrics. The inexcitability threshold and current density magnitudes in the elements of the heart were used to calculate the defibrillation metrics. The volumes of the heart elements were sorted in ascending order of current density magnitude. Starting at the lowest current density magnitude, the volumes of the heart elements were summed until the subtotal was equal to 25% of the total myocardial volume. All current density magnitudes and voltages were then scaled so that the value of the current density at the critical mass point was equal to the assumed inexcitability threshold (Jth) of 17.5 mA/cm2. The defibrillation threshold current, Ith, was the scaled total current delivered by the electrodes, the defibrillation threshold voltage, Vth, was the scaled applied voltage. The impedance, Z, was the ratio between the voltage and current. The delivered energy, or the DFT, was computed by equation (3) considering a biphasic pulse (fig. 3). with 60% tilt in the positive phase and 50% tilt in the negative phase corresponding to the CPI Ventak model (Cardiac Pacemakers Inc.) used in clinical trials.
 (3)
(3)
|
|
Fig. 3. An example of CPI biphasic waveform. The waveform has a 60% tilt in positive phase and 50% tilt in negative phase. The pulse width of the first (PW1) and second phase (PW2) is 60% and 40% respectively of the total length.
The
AICD has a 150 mF capacitor
from which the pulse was delivered. The total duration of the biphasic pulse
can be determined considering the waveform characteristics, and it is Ttotal=1.61t, where t is the time
constant of the ZC circuit.
RESULTS
Figure
4 and figure 5 show the current density and electric potential distributions
obtained for one of the six patients reported here. The defibrillation metrics
calculated for the six out of ten patients involved in this study are listed in
table 1.
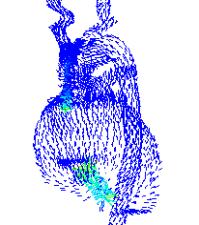
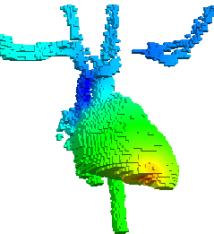
Fig. 4
Current density distribution Fig. 5
Electric potential distribution. (geometry-based model)
(voxel-based
model)
|
|
DFT
[J] |
Ith
[A] |
Vth
[V] |
Z
[W] |
|
Patient
#1 |
12.4 |
9.6 |
415.9 |
43.2 |
|
Patient
#2 |
8.6 |
8.2 |
346.6 |
41.9 |
|
Patient
#3 |
6.4 |
7.6 |
299.9 |
39.3 |
|
Patient
#4 |
4.6 |
6.4 |
253.1 |
39.0 |
|
Patient
#5 |
10.8 |
9.35 |
388.7 |
41.5 |
|
Patient
#6 |
10.4 |
10.9 |
380.6 |
34.7 |
Table 1. Model
predicted values for defibrillation parameters
After
completion of all ten patient-specific models, the calculated defibrillation
parameters will be compared with the clinical metrics obtained during AICD
implantation procedure. If model and clinical values are in good agreement then
work can be pursue to use these type of models in pre-surgical planning of AICD
implantation.
References:
[1] C.J. Wiggers, “The mechanism and nature of ventricular
fibrillation,” Am. Heart J. 20, 399-412 (1940).
[2] A.T. Winfree, “Electrical turbulence in three-dimensional heart
muscle,” Science 266, 1003-1006 (1994)
[3] T.F. Kinst, M.O. Sweeney, J.L. Lehr, S.R. Eisenberg, “Simulated
internal defibrillation in humans using an
anatomically realistic
three-dimensional finite element model of the thorax,”J. Cardiovasc.
Electrophysiol. 8, 537-547 (1997).
[4] I-DEAS Master Series 6 Engineering Analysis
Software, Structural Dynamics Research Corporation.
[5] http://splweb.bwh.harvard.edu:8000/pages/papers/slicer/index.html.
![]()